The Attention Conundrum
Author: Shano Ahmad
Published: 27th February 2024
The Attention Conundrum – Promise vs. Reality
Attention has emerged as a buzz-worthy topic in advertising circles, with companies trying to develop models that can measure users’ attention when watching specific creatives and predict their performance.
In previous studies, we have demonstrated that TV ads exhibit greater efficacy when viewers engage in second-screening activities, diverting their attention away from the television screen. This somewhat counter-intuitive revelation challenges the reliability of traditional “eye-tracking” studies in predicting attention and, subsequently, campaign effectiveness.
Prior to the holiday season, System1 released research purporting to predict the strength of various Christmas creatives by gauging viewer attention. If successful, such predictions could prove invaluable to brands and creative agencies, potentially saving millions by identifying attention-grabbing creatives poised to drive sales.
Reality Check: Discrepancies Unveiled
Armed with our Single-Source data, we set out to measure the actual effectiveness of the campaigns and compare System1’s forecasts against the actual campaign results.
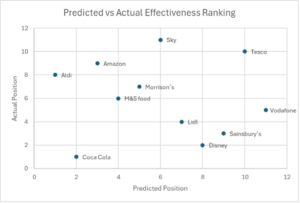
The results were quite disappointing – we found no discernible correlation between System1’s predictions and the real-world performance of the campaigns. Despite their best efforts to forecast success based on attention metrics, the data told a different story.
A glance at the predicted rankings versus the post-campaign rankings revealed stark disparities:
| Brand | System1 Prediction | Actual Post-campaign Ranking | Uplift per 10M Impacts | |
| Aldi | 5.9-Stars (1) | 8th | 0.42% | |
| Coca Cola | 5.9-Stars (2) | 1st (*) | 9.88% (*) | |
| Amazon | 5.9-Stars (3) | 9th | 0.37% | |
| M&S food | 5.9-Stars (4) | 6th | 0.87% | |
| Morrison’s | 5.9-Stars (5) | 7th | 0.47% | |
| Sky | 5.8-Stars (6) | 11th | 0.31% | |
| Lidl | 5.8-Stars (7) | 4th | 1.26% | |
| Disney | 5.7-Stars (8) | 2nd | 2.15% | |
| Sainsbury’s | 5.7-Stars (9) | 3rd | 1.42% | |
| Tesco | 5.7-Stars (10) | 10th | 0.35% | |
| Vodafone | 5.6-Stars (11) | 5th | 1.10% |
(*) Note: Coca-Cola’s campaign duration was significantly shorter, impacting direct comparison.
Even when focusing solely on supermarket brands, the disparity persisted:
| Brand | System1 Prediction | Uplift per
10M Impacts |
Post-campaign
Ranking |
| Aldi | 5.9-Stars (1) | 0.42% | 5th |
| Marks and Spencer’s Food | 5.9-Stars (2) | 0.87% | 3rd |
| Morrison’s | 5.9-Stars (3) | 0.47% | 4th |
| Lidl | 5.8-Stars (4) | 1.26% | 2nd |
| Sainsbury’s | 5.7-Stars (5) | 1.42% | 1st |
| Tesco | 5.7-Stars (6) | 0.35% | 6th |
Conclusion:
While attention undoubtedly plays a role in the effectiveness of TV campaigns, our research casts doubt on the reliability of current attention metrics to predict campaign success. Despite the hype surrounding attention models, their practical utility remains questionable in real-world scenarios.
So, what’s the next step?
The measurement of attention is still in its infancy and not yet ready for commercial usage. To advance this field, companies must move beyond traditional eye-tracking methods and explore alternative approaches to measuring attention. Moreover, any proposed solutions should undergo rigorous testing against the actual performance of campaigns on a large scale before they can be deemed reliable predictors of campaign success. Only through such thorough validation can attention metrics evolve into valuable tools for advertisers and marketers.
Methodology – How did we do it?
We used a natural test and control methodology based on our Single-Source data. Single-source data is the measurement of TV and other media exposure, purchase behaviour and location data over time on the same individual. ViewersLogic gathers its passively collected Single-Source data from the first-of-its-kind consumer panel in the UK.
Control Group: Individuals who were not exposed to TV activity from the brand in question during the campaign period or in the 2 weeks prior.
Test Group: Individuals who were exposed to TV activity from the brand in question during the campaign period but not in the two weeks prior.
A response may be a site visit, an app usage, a product purchase or a store visit (depending on the brand’s KPIs), de-duplicated so that we can only have a maximum of one response per user per week. The response rate is the number of responses as a percentage of the entire group.
We compared the response rate of each group before and during the campaign and calculated the uplift of the test group that was over and above the control group. For example: for every 10M impacts the chance of the test group to visit the Amazon website or app grew by 0.37 % over the control group.