Measuring the true effectiveness of your TikTok Campaign
Author: Shano Ahmad
Published: 5th July 2024
It is a known fact that users almost do not click on video ads. So how can we measure their effectiveness?
When it comes to A/V advertising on platforms such as TikTok and YouTube, where user engagement reigns supreme, clicks cannot be the measure of success. Unlike traditional online advertising, TikTok doesn’t capture all responses generated by ads as the majority of users are not immediately clicking. So, does this mean your TikTok ads are ineffective and that your CFO is right to cut your marketing budget? What about the brand impact your ads had on your audience’s behaviour? This can leave brands scratching their heads and wondering if there is a way to measure this.
Well, of course, there is.
We analyzed two TikTok campaigns at Viewerslogic. One campaign was for Booking.com, the other for Three UK. Both analyses aimed to understand if seeing the ads (being exposed) would translate to increased website visits in the week following the exposure.
We looked at three groups of people: those who saw at least one ad (exposed group) and those who didn’t (non-exposed group). The non-exposed group was further divided – one group consisted solely of TikTok users (TT) and the other included everyone else on our panel, including users who don’t use TikTok (All). We have done this in order to observe any bias that can come from the fact that TikTok’s demographics are very different to the general population so we wanted to compare apples to apples.
Booking.com’s Success Story
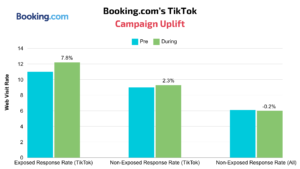
The Booking.com analysis paints a clear picture. The website visit rate for the exposed group grew much more during the campaign than the visit rate of the non-exposed group. This translates to one key takeaway: Seeing the ad on TikTok demonstrably increased website visits for Booking.com.
Three UK:
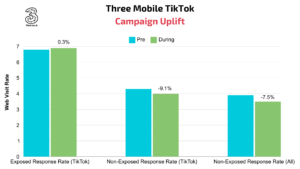
The analysis for Three UK presents a more intriguing scenario. Overall website traffic (All) dipped during the campaign period. However, while the exposed group visit rate increased slightly (+0.3%) the visit rate of both non-exposed groups dipped by 9.1% and 7.5%. While the total traffic of Three declined during this period – it does not mean that the campaign didn’t work. On the contrary, without the campaign, the dip would have been much stronger.
This finding highlights a crucial point. Traditional metrics like overall website traffic can provide an incomplete picture of success, particularly on platforms like TikTok. Here’s why: Three UK might have perceived the campaign as unsuccessful due to the drop in overall traffic. However, by analyzing website visit rates for the exposed group, we reveal a different story – the ad campaign did drive website visits for those who saw it.
We at Viewerslogic, leverage our Single Source Data panel to track who sees your TikTok ad (exposed group) and analyze their subsequent behaviour. This allows us to determine if seeing your ad led to a key action, like visiting your website (site visit).
Benefits of measuring your TikTok ads with Viewerslogic
Attribution Made Easy: Attributing conversions (like sales or website visits) to the right marketing channel can be a complex task. Viewerslogic simplifies this process by clearly showing how your TikTok ads contribute to website traffic, even in the absence of clicks.
Data-Driven Optimization: Armed with concrete data on how users exposed to your TikTok ads behave, you can optimize your future campaigns for maximum impact. This allows you to refine your targeting, messaging, and creative strategy for better results.
By understanding how your ads influence user behaviour, you can make informed decisions, optimize your campaigns, and ultimately achieve your marketing goals.