How to Increase Share of Voice Potential in TV Advertising
Author: ronny
Published: 15th May 2022
The problem
In TV advertising, Share of Voice (SoV) calculation is the total ad exposures of a specific brand compared to the total exposures of the entire sector and can be used to assess the return on media investment.
In most campaigns though understanding how to increase Share of Voice potential is just an afterthought for media planners who focus on other campaign metrics. But how important is Share of Voice and how can planners understand its impact on consumer behaviour?
We wanted to see if SoV had an effect on consumer actions such as website visits, quote requests and the purchase of car insurance itself.
How did we do it?
Through our Single-Source data we conducted a deep analysis on thousands of consumers who were interested in buying car insurance. We looked at all the steps of their journey that they actively engaged with, including visits to price comparison and insurance websites, searches, TV and online ad exposure, marketing emails and more.
Using *Natural A/B testing, we isolated journeys that included these actions, and looked at the SoV for these consumers in the week before they started the journey. For each consumer we looked at their own SoV, not the general SoV for all consumers during that week.
It was interesting to see that there was a very strong correlation between the action performed and the Share of Voice.
The results:
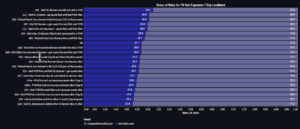
- On average, consumers who visited a specific website had an 8.5% higher SoV of the brand they visited compared to the entire population.
- Consumers who asked for a quote had an 11.66% higher SoV for the brand they requested a quote from (this rises to 13.3% if we remove LV).
- Finally, consumers who purchased car insurance, had on average a 21% higher SoV for the brand from which they bought the insurance, compared to the general population.
| General SoV | Visited the domain | Asked for a quote | Purchase car insurance | |
| Aviva | 18.8% | 20.3% (+8%) | 22.8% (+21%) | N/A |
| Admiral | 6.4% | 7.5% (+16%) | 7.2% (+12%) | 9.6% (+49%) |
| AA | 27.5% | 29.6% (+8%) | 29.4% (+7%) | 28.6% (+4%) |
| LV | 18.2% | 18.5% (+2%) | 17.3% (-5%) | 20% (+10%)
|
Methodology:
These findings are based on ViewersLogic Single-Source data which is derived from our panel of 8000 UK consumers for which we can see their TV viewing, online behaviour, online and offline purchases as well as offline store visits. This unique opt-in database enables us to look into the journey to purchase for each and every brand and understand how media affects it.
To find out how Single-Source data can help you identify the optimal SoV for your brand and improve campaign results, reach out to us here.
*Natural A/B testing
ViewersLogic’s Single-Source data enables hypotheses to be checked immediately by comparing a control group with a test group.
Control Group: Individuals who were not exposed to the ad in question during the campaign period or in the two weeks prior.
Test Group: Individuals who were exposed to the ad in question during the campaign period but not in the two weeks prior.